Information on Metal Plating: Demographics (Part I)
Sometimes it’s hard to obtain information on metal plating due to a lack of research conducted in this field. For this reason, American Plating Company has decided to release some of the information we have recently collected from the US Census Bureau. While this information is readily available for free, we believe this overview will save readers time in their efforts to learn more about the metal plating industry as a whole.
What is Covered in the Report?
In part I of this report, we will take a look at industrial metal plating demographics with a focus on: (A.) Business patterns by employment size class and (B.) Key economic census data. The two areas will provide information related to:
Geographic Area
Number of Establishments and Employees
Establishment Size
Annual Payroll
Total Sales
And More…
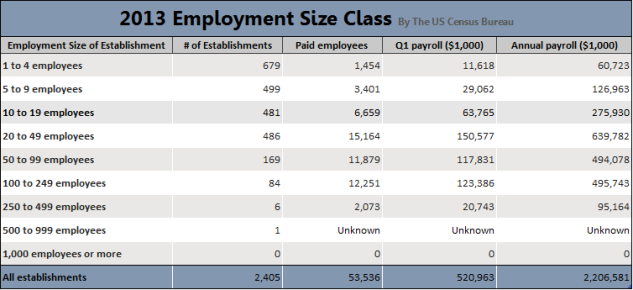
Please keep in mind this information on metal plating is based on U.S. data only and does not reflect the industry from a global outlook. With this being said we will now look at business patterns by employment size class which is based on the most recent data collected by the U.S. Census Bureau from the year 2013,
A. Business Patterns by Employment Size Class
From the graph it is clear that most electroplating business in the U.S. is conducted in small shops with less than 50 employees. This group makes up 1,659 of the 2,405 total establishments (69%). The only puzzling information from this data set seems to come from the annual payroll column which decreases once 50 employees is reached. If anyone can explain this in greater detail feel free to comment or send us an email.
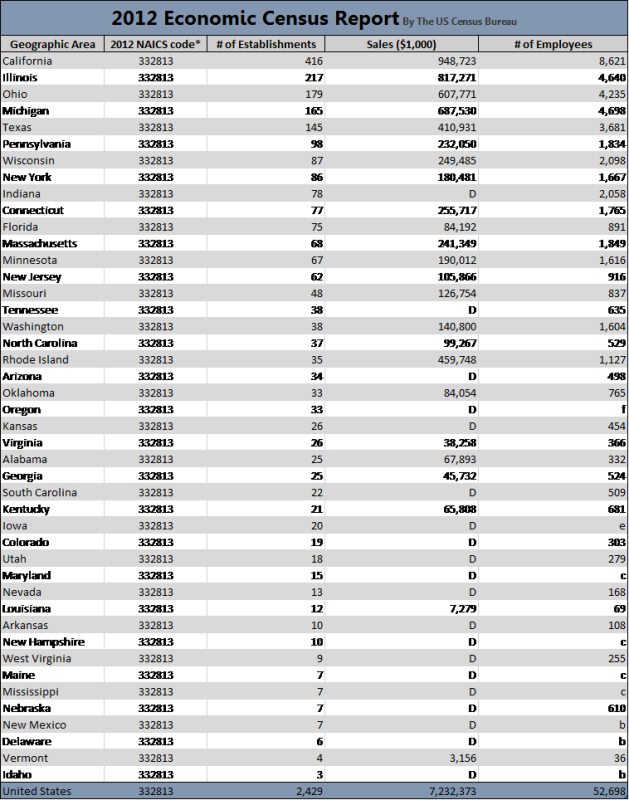
Now let’s take a look at more information on metal plating from a much larger data set which looks at key economic data on the industry from the most recent 2012 economic census.
A. Key Economic Census Data
From this information, it seems as though the bulk of metal plating occurs in the following five states:
1. California
2. Illinois
3. Ohio
4. Michigan
5. Texas
These five states are home to 1,122 of the 2,429 total metal plating organizations in the U.S. (46%). They also hold about 3.5 billion of the total 7.2 billion in U.S. sales (48%).
Thanks for Reading, “Information on Metal Plating: Demographics (Part I)!”
We hope this information on metal plating was helpful. As time goes on we will continue to post more data on this topic which will also include an analysis of the customer base and predictions for the future of the metal plating industry.
Until then, feel free to check out our other blog posts or contact us with any questions you may have.
References:


